Description
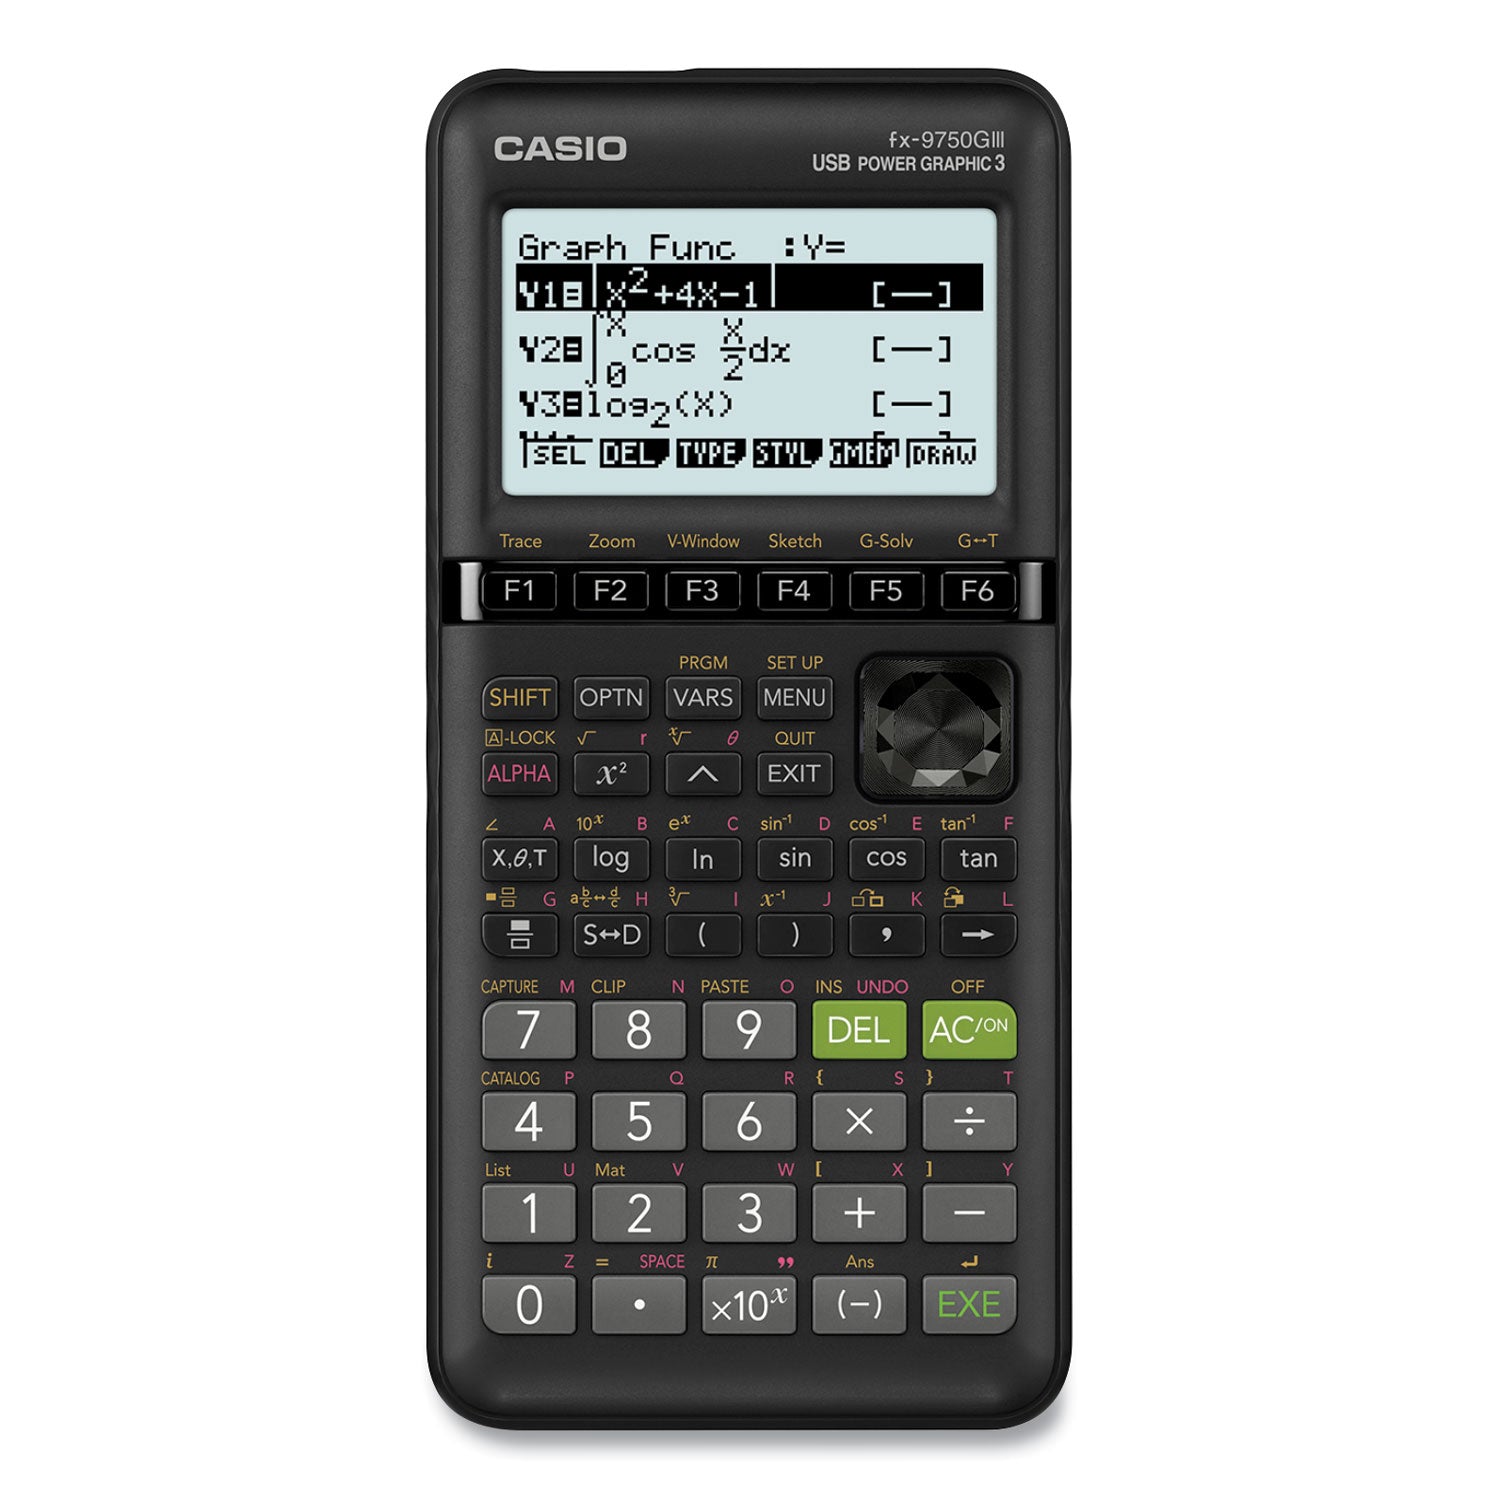
Graphing Calculator supports students and educators from middle school to high school and into college. Its icon-based menu is easy to navigate and the soft-menus make it easy to access functionality for common tasks. The intuitive software design facilitates a student's grasp of mathematical concepts, by encouraging student engagement with mathematics, rather than the memorization of keys to effectively promote student success. Recommended for students taking Pre-Algebra, Algebra I and II, Geometry, Trigonometry, AP Calculus, AP Statistics, Biology, Physics, and Business and Finance.
- Icon menu provides easy access to advanced functions; Graph rectangular, polar and parametric functions and inequalities, graphical analysis, streamlined solving for intercepts, intersections, etc.
- Python Programming Language and user-selectable order of operation and math input/output.
- 20 graphical functions: Various icon (Run, Table, Dynamic, Recursion and Conics) will allow you to graph or analyze the graphs of given information. You can graph in the form of r = polar coordinates, parametric functions, x =, and y-inequalities.
- The Matrix mode allows you to perform matrix operations on matrices with up to 6 rows and 6 columns.
- This calculator includes an icon menu is used to graph parabolas, circles, ellipses, and hyperbolas. You can input a rectangular function, polar coordinate function or a parametric function for graphing.
- Suggested Courses: Pre-Algebra, Algebra I & II, Geometry, Trigonometry, AP Calculus, AP Statistics, Biology, Physics, Business and Finance.
- Dot matrix display 128 x 64.
- Any time while operating the calculator, you can capture an image of the current screen and save it in capture memory to recall at a later time.

